
Preface
I’m a big fan of Prometheus and Grafana. As a former SRE at Google I’ve learned to appreciate good monitoring, and this combination has been a winner for me over the past year. I’m using them for monitoring my personal servers (both black-box and white-box monitoring), for the Euskal Encounter external and internal event infra, for work I do professionally for clients, and more. Prometheus makes it very easy to write custom exporters to monitor your own data, and there’s a good chance you’ll find an exporter that already works for you out of the box. For example, we use sql_exporter to make a pretty dashboard of attendee metrics for the Encounter events.
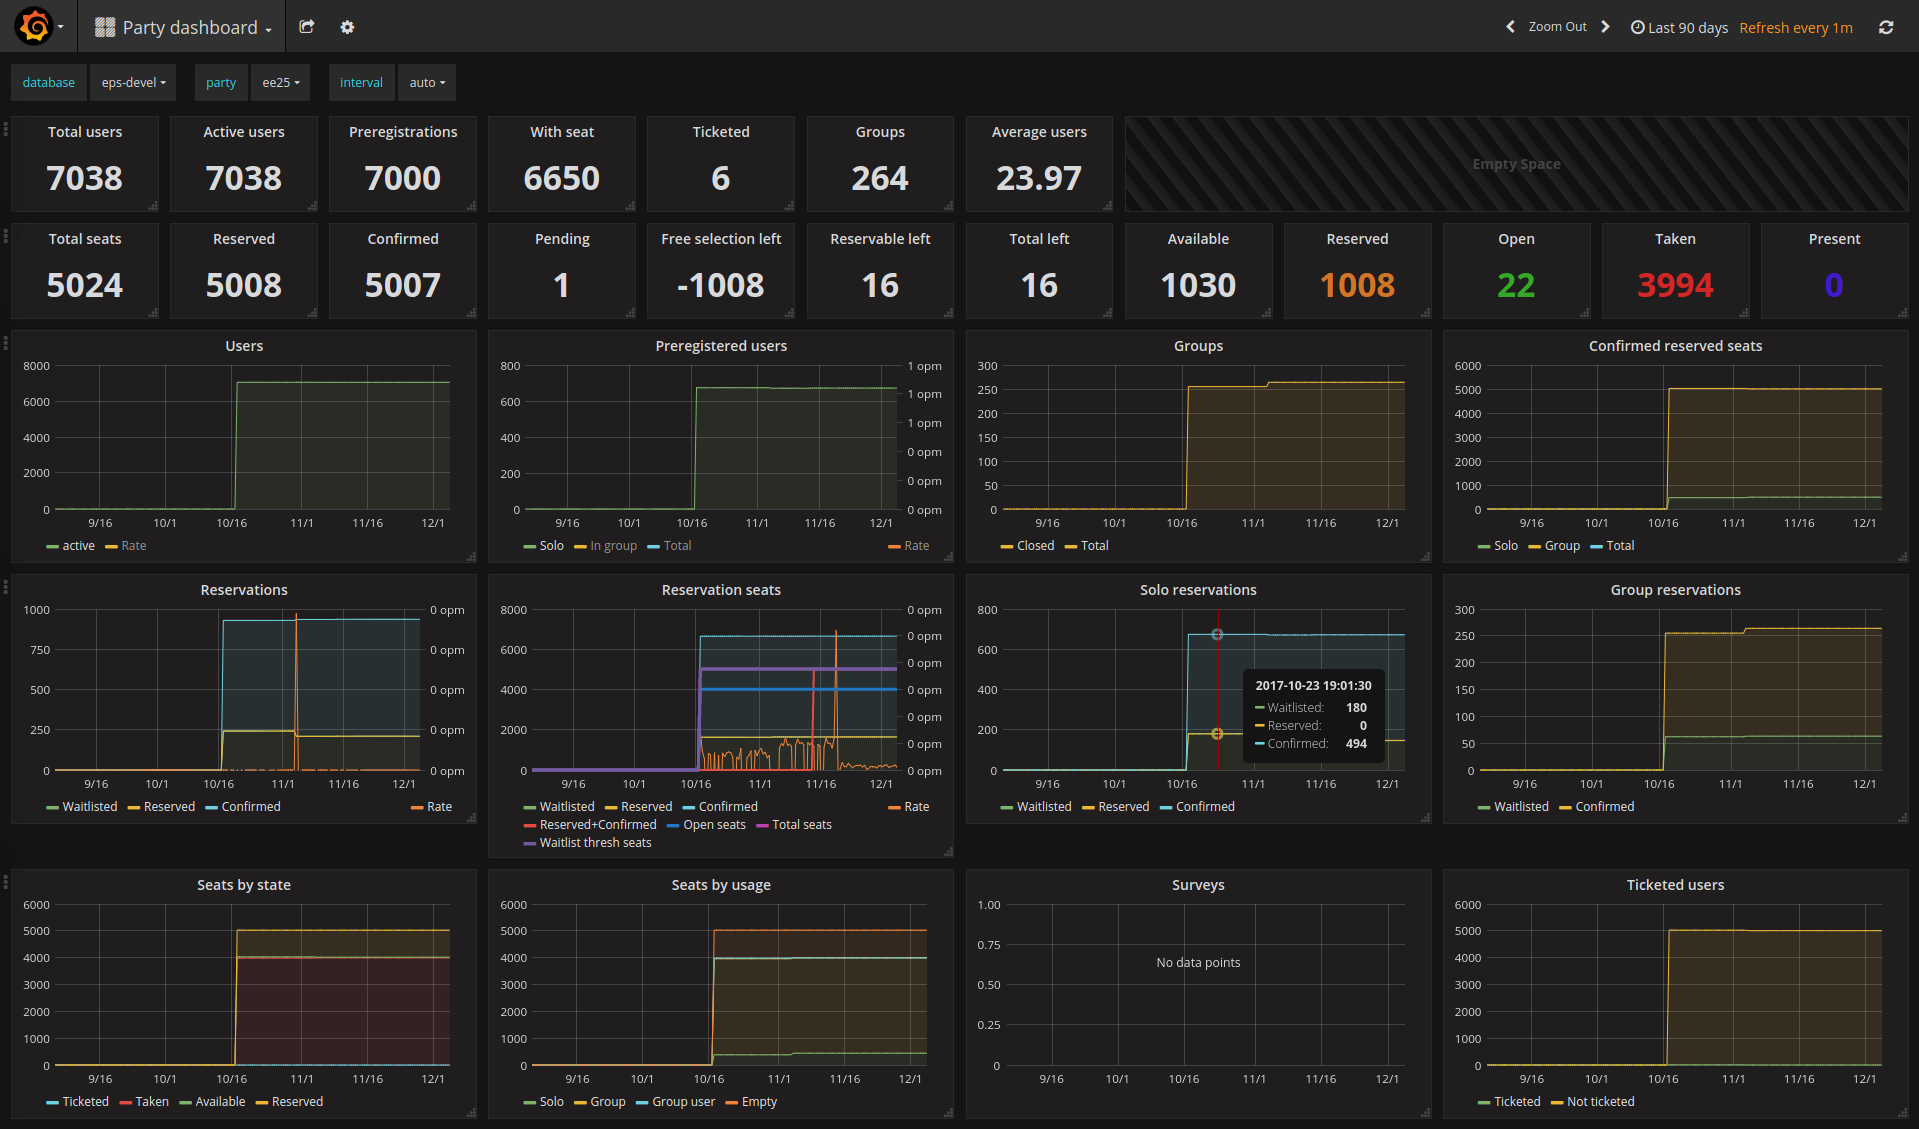
Event dashboard for Euskal Encounter (fake staging data)
Since it’s so easy to throw
node_exporter onto any random
machine and have a Prometheus instance scrape it for basic system-level metrics
(CPU, memory, network, disk, filesystem usage, etc), I figured, why not also
monitor my laptop? I have a Clevo “gaming” laptop that serves as my primary
workstation, mostly pretending to be a desktop at home but also traveling with
me to big events like the Chaos Communication Congress. Since I already have a
VPN between it and one of my servers where I run Prometheus, I can just
emerge prometheus-node_exporter, bring up the service, and point my Prometheus
instance at it. This automatically configures alerts for it, which means my
phone will make a loud noise whenever I open way too many Chrome tabs and run
out of my 32GB of RAM. Perfect.
Trouble on the horizon
Barely an hour after setting this up, though, my phone did get a page: my
newly-added target was inaccessible. Alas, I could SSH into the laptop fine, so
it was definitely up, but node_exporter had crashed.
fatal error: unexpected signal during runtime execution
[signal SIGSEGV: segmentation violation code=0x1 addr=0xc41ffc7fff pc=0x41439e]

goroutine 2395 [running]:
runtime.throw(0xae6fb8, 0x2a)
        /usr/lib64/go/src/runtime/panic.go:605 +0x95 fp=0xc4203e8be8 sp=0xc4203e8bc8 pc=0x42c815
runtime.sigpanic()
        /usr/lib64/go/src/runtime/signal_unix.go:351 +0x2b8 fp=0xc4203e8c38 sp=0xc4203e8be8 pc=0x443318
runtime.heapBitsSetType(0xc4204b6fc0, 0x30, 0x30, 0xc420304058)
        /usr/lib64/go/src/runtime/mbitmap.go:1224 +0x26e fp=0xc4203e8c90 sp=0xc4203e8c38 pc=0x41439e
runtime.mallocgc(0x30, 0xc420304058, 0x1, 0x1)
        /usr/lib64/go/src/runtime/malloc.go:741 +0x546 fp=0xc4203e8d38 sp=0xc4203e8c90 pc=0x411876
runtime.newobject(0xa717e0, 0xc42032f430)
        /usr/lib64/go/src/runtime/malloc.go:840 +0x38 fp=0xc4203e8d68 sp=0xc4203e8d38 pc=0x411d68
github.com/prometheus/node_exporter/vendor/github.com/prometheus/client_golang/prometheus.NewConstMetric(0xc42018e460, 0x2, 0x3ff0000000000000, 0xc42032f430, 0x1, 0x1, 0x10, 0x9f9dc0, 0x8a0601, 0xc42032f430)
        /var/tmp/portage/net-analyzer/prometheus-node_exporter-0.15.0/work/prometheus-node_exporter-0.15.0/src/github.com/prometheus/node_exporter/vendor/github.com/prometheus/client_golang/prometheus/value.go:165 +0xd0 fp=0xc4203e8dd0 sp=0xc4203e8d68 pc=0x77a980
node_exporter, like many Prometheus components, is written in Go. Go is a
relatively safe language: while it allows you to shoot yourself in the foot if
you so wish, and it doesn’t have nearly as strong safety guarantees as, say,
Rust does, it is still not too easy to accidentally cause a segfault in Go.
More so, node_exporter is a relatively simple Go app with mostly pure-Go
dependencies. Therefore, this was an interesting crash to get. Especially since
the crash was inside mallocgc, which should never crash under normal
circumstances.
Things got more interesting after I restarted it a few times:
2017/11/07 06:32:49 http: panic serving 172.20.0.1:38504: runtime error: growslice: cap out of range
goroutine 41 [running]:
net/http.(*conn).serve.func1(0xc4201cdd60)
        /usr/lib64/go/src/net/http/server.go:1697 +0xd0
panic(0xa24f20, 0xb41190)
        /usr/lib64/go/src/runtime/panic.go:491 +0x283
fmt.(*buffer).WriteString(...)
        /usr/lib64/go/src/fmt/print.go:82
fmt.(*fmt).padString(0xc42053a040, 0xc4204e6800, 0xc4204e6850)
        /usr/lib64/go/src/fmt/format.go:110 +0x110
fmt.(*fmt).fmt_s(0xc42053a040, 0xc4204e6800, 0xc4204e6850)
        /usr/lib64/go/src/fmt/format.go:328 +0x61
fmt.(*pp).fmtString(0xc42053a000, 0xc4204e6800, 0xc4204e6850, 0xc400000073)
        /usr/lib64/go/src/fmt/print.go:433 +0x197
fmt.(*pp).printArg(0xc42053a000, 0x9f4700, 0xc42041c290, 0x73)
        /usr/lib64/go/src/fmt/print.go:664 +0x7b5
fmt.(*pp).doPrintf(0xc42053a000, 0xae7c2d, 0x2c, 0xc420475670, 0x2, 0x2)
        /usr/lib64/go/src/fmt/print.go:996 +0x15a
fmt.Sprintf(0xae7c2d, 0x2c, 0xc420475670, 0x2, 0x2, 0x10, 0x9f4700)
        /usr/lib64/go/src/fmt/print.go:196 +0x66
fmt.Errorf(0xae7c2d, 0x2c, 0xc420475670, 0x2, 0x2, 0xc420410301, 0xc420410300)
        /usr/lib64/go/src/fmt/print.go:205 +0x5a
Well that’s interesting. A crash in Sprintf this time. What?
runtime: pointer 0xc4203e2fb0 to unallocated span idx=0x1f1 span.base()=0xc4203dc000 span.limit=0xc4203e6000 span.state=3
runtime: found in object at *(0xc420382a80+0x80)
object=0xc420382a80 k=0x62101c1 s.base()=0xc420382000 s.limit=0xc420383f80 s.spanclass=42 s.elemsize=384 s.state=_MSpanInUse
 <snip>
fatal error: found bad pointer in Go heap (incorrect use of unsafe or cgo?)

runtime stack:
runtime.throw(0xaee4fe, 0x3e)
        /usr/lib64/go/src/runtime/panic.go:605 +0x95 fp=0x7f0f19ffab90 sp=0x7f0f19ffab70 pc=0x42c815
runtime.heapBitsForObject(0xc4203e2fb0, 0xc420382a80, 0x80, 0xc41ffd8a33, 0xc400000000, 0x7f0f400ac560, 0xc420031260, 0x11)
        /usr/lib64/go/src/runtime/mbitmap.go:425 +0x489 fp=0x7f0f19ffabe8 sp=0x7f0f19ffab90 pc=0x4137c9
runtime.scanobject(0xc420382a80, 0xc420031260)
        /usr/lib64/go/src/runtime/mgcmark.go:1187 +0x25d fp=0x7f0f19ffac90 sp=0x7f0f19ffabe8 pc=0x41ebed
runtime.gcDrain(0xc420031260, 0x5)
        /usr/lib64/go/src/runtime/mgcmark.go:943 +0x1ea fp=0x7f0f19fface0 sp=0x7f0f19ffac90 pc=0x41e42a
runtime.gcBgMarkWorker.func2()
        /usr/lib64/go/src/runtime/mgc.go:1773 +0x80 fp=0x7f0f19ffad20 sp=0x7f0f19fface0 pc=0x4580b0
runtime.systemstack(0xc420436ab8)
        /usr/lib64/go/src/runtime/asm_amd64.s:344 +0x79 fp=0x7f0f19ffad28 sp=0x7f0f19ffad20 pc=0x45a469
runtime.mstart()
        /usr/lib64/go/src/runtime/proc.go:1125 fp=0x7f0f19ffad30 sp=0x7f0f19ffad28 pc=0x430fe0
And now the garbage collector stumbled upon a problem. Yet a different crash.
At this point, there are two natural conclusions: either I have a severe
hardware issue, or there is a wild memory corruption bug in the binary. I
initially considered the former unlikely, as this machine has a very heavily
mixed workload and no signs of instability that can be traced back to hardware
(I have my fair share of crashing software, but it’s never random). Since Go
binaries like node_exporter are statically linked and do not depend on any other
libraries, I can download the official release binary and try that, which would
eliminate most of the rest of my system as a variable. Yet, when I did so, I
still got a crash.
unexpected fault address 0x0
fatal error: fault
[signal SIGSEGV: segmentation violation code=0x80 addr=0x0 pc=0x76b998]

goroutine 13 [running]:
runtime.throw(0xabfb11, 0x5)
        /usr/local/go/src/runtime/panic.go:605 +0x95 fp=0xc420060c40 sp=0xc420060c20 pc=0x42c725
runtime.sigpanic()
        /usr/local/go/src/runtime/signal_unix.go:374 +0x227 fp=0xc420060c90 sp=0xc420060c40 pc=0x443197
github.com/prometheus/node_exporter/vendor/github.com/prometheus/client_model/go.(*LabelPair).GetName(...)
        /go/src/github.com/prometheus/node_exporter/vendor/github.com/prometheus/client_model/go/metrics.pb.go:85
github.com/prometheus/node_exporter/vendor/github.com/prometheus/client_golang/prometheus.(*Desc).String(0xc4203ae010, 0xaea9d0, 0xc42045c000)
        /go/src/github.com/prometheus/node_exporter/vendor/github.com/prometheus/client_golang/prometheus/desc.go:179 +0xc8 fp=0xc420060dc8 sp=0xc420060c90 pc=0x76b998
Yet another completely different crash. At this point there was a decent chance
that there was truly an upstream problem with node_exporter or one of its
dependencies, so I filed an
issue on GitHub.
Perhaps the developers had seen this before? It’s worth bringing this kind of
issue to their attention and seeing if they have any ideas.
A not-so-brief bare metal detour
Unsurprisingly, upstream’s first guess was that it was a hardware issue. This
isn’t unreasonable: after all, I’m only hitting the problem on one specific
machine. All my other machines are happily running node_exporter. While I had no
other evidence of hardware-linked instability on this host, I also had no other
explanation as to what was so particular about this machine that would make
node_exporter crash. A Memtest86+ run never hurt
anyone, so I gave it a go.
And then this happened:
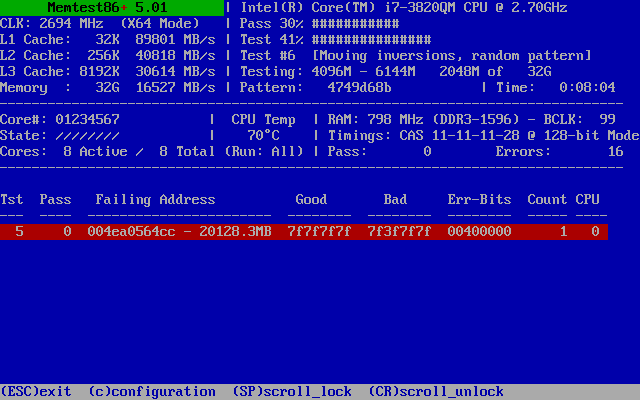
This is what I get for using consumer hardware
Whoops! Bad RAM. Well, to be more specific, one bit of bad RAM. After letting the test run for a full pass, all I got was that single bad bit, plus a few false positives in test 7 (which moves blocks around and so can amplify a single error).
Further testing showed that Memtest86+ test #5 in SMP mode would quickly detect the error, but usually not on the first pass. The error was always the same bit at the same address. This suggests that the problem is a weak or leaky RAM cell. In particular, one which gets worse with temperature. This is quite logical: a higher temperature increases leakage in the RAM cells and thus makes it more likely that a somewhat marginal cell will actually cause a bit flip.
To put this into perspective, this is one bad bit out of 274,877,906,944. That’s actually a very good error rate! Hard disks and Flash memory have much higher error rates - it’s just that those devices have bad blocks marked at the factory that are transparently swapped out without the user knowing, and can transparently mark newly discovered weak blocks as bad and relocate them to a spare area. RAM has no such luxury, so a bad bit sticks forever.
Alas, this is vanishingly unlikely to be the cause of my node_exporter woes.
That app uses very little RAM, and so the chances of it hitting the bad bit
(repeatedly, at that) are extremely low. This kind of problem would be largely
unnoticeable, perhaps causing a pixel error in some graphics, a single letter
to flip in some text, an instruction to be corrupted that probably won’t ever
be run, and perhaps the rare segfault when something actually important does
land on the bad bit. Nonetheless, it does cause long-term reliability issues,
and this is why servers and other devices intended to be reliable must use ECC
RAM, which can correct this kind of error.
I don’t have the luxury of ECC RAM on this laptop. What I do have, though, is the ability to mark the bad block of RAM as bad and tell the OS not to use it. There is a little-known feature of GRUB 2 which allows you to do just that, by changing the memory map that is passed to the booted kernel. It’s not worth buying new RAM just for a single bad bit (especially since DDR3 is already obsolete, and there’s a good chance new RAM would have weak cells anyway), so this is a good option.
However, there’s one more thing I can do. Since the problem gets worse with temperature, what happens if I heat up the RAM?

🔥🔥🔥memtest86+🔥🔥🔥

A cozy 100°C
Using a heat gun set at a fairly low temperature (130°C) I warmed up two modules at a time (the other two modules are under the rear cover, as my laptop has four SODIMM slots total). Playing around with module order, I found three additional weak bits only detectable at elevated temperature, and they were spread around three of my RAM sticks.
I also found that the location of the errors stayed roughly consistent even as I swapped modules around: the top bits of the address remained the same. This is because the RAM is interleaved: data is spread over all four sticks, instead of each stick being assigned a contiguous quarter of the available address space. This is convenient, because I can just mask a region of RAM large enough to cover all possible addresses for each error bit, and not have to worry that I might swap sticks in the future and mess up the masking. I found that masking a contiguous 128KiB area should cover all possible permutations of addresses for each given bad bit, but, for good measure, I rounded up to 1MiB. This gave me three 1MiB aligned blocks to mask out (one of them covers two of the bad bits, for a total of four bad bits I wanted masked):
0x36a700000–0x36a7fffff0x460e00000–0x460efffff0x4ea000000–0x4ea0fffff
This can be specified using the address/mask syntax required by GRUB as follows,
in /etc/default/grub:
GRUB_BADRAM="0x36a700000,0xfffffffffff00000,0x460e00000,0xfffffffffff00000,0x4ea000000,0xfffffffffff00000"
One quick grub-mkconfig later, I am down 3MiB of RAM and four dodgy bits with
it. It’s not ECC RAM, but this should increase the effective reliability of my
consumer-grade RAM, since now I know the rest of the memory is fine up to at
least 100°C.
Needless to say, node_exporter still crashed, but we knew this wasn’t the real
problem, didn’t we.
Digging deeper
The annoying thing about this kind of bug is that it clearly is caused by some kind of memory corruption that breaks code that runs later. This makes it very hard to debug, because we can’t predict what will be corrupted (it varies), and we can’t catch the bad code in the act of doing so.
First I tried some basic bisecting of available node_exporter releases and
enabling/disabling different collectors, but that went nowhere. I also tried
running an instance under strace. This seemed to stop the crashes, which
strongly points to a race-condition kind of problem. strace will usually wind
up serializing execution of apps to some extent, by intercepting all system
calls run by all threads. I would later find that the strace instance crashed
too, but it took much longer to do so. Since this seemed to be related to
concurrency, I tried setting GOMAXPROCS=1, which tells Go to only use a single
OS-level thread to run Go code. This also stopped the crashes, again pointing
strongly to a concurrency issue.
By now I had gathered quite a considerable number of crash logs, and I was starting to notice some patterns. While there was a lot of variation in the parts that were crashing and how, ultimately the error messages could be categorized into different types and the same kind of error showed up more than once. So I started Googling these errors, and this is how I stumbled upon Go issue #20427. This was an issue in seemingly an unrelated part of Go, but one that had caused similar segfaults and random issues. The issue was closed with no diagnosis after it couldn’t be reproduced with Go 1.9. Nobody knew what the root cause was, just that it had stopped happening.
So I grabbed
this sample
code from the issue, which claimed to reproduce the problem, and ran it on my
machine. Lo and behold, it crashed within seconds. Bingo. This is a lot better
than waiting hours for node_exporter to crash.
That doesn’t get me any closer to debugging the issue from the Go side, but it gives me a much faster way to test for it. So let’s try another angle.
Bisecting machines
I know the problem happens on my laptop, but doesn’t happen on any other of my machines. I tried the reproducer on every other machine I have easy access to, and couldn’t get it to crash on any of them. This tells me there’s something special about my laptop. Since Go statically links binaries, the rest of userspace doesn’t matter. This leaves two relevant parts: the hardware, and the kernel.
I don’t have any easy way to test with various hardware other than the machines I own, but I can play with kernels. So let’s try that. First order of business: will it crash in a VM?
To test for this, I built a minimal initramfs that will allow me to very quickly
launch the reproducer in a QEMU VM without having to actually install a distro
or boot a full Linux system. My initramfs was built with Linux’s
scripts/gen_initramfs_list.sh and contained the following files:
dir /dev 755 0 0
nod /dev/console 0600 0 0 c 5 1
nod /dev/null 0666 0 0 c 1 3
dir /bin 755 0 0
file /bin/busybox busybox 755 0 0
slink /bin/sh busybox 755 0 0
slink /bin/true busybox 755 0 0
file /init init.sh 755 0 0
file /reproducer reproducer 755 0 0
/init is the entry point of a Linux initramfs, and in my case was a simple
shellscript to start the test and measure time:
#!/bin/sh
export PATH=/bin

start=$(busybox date +%s)

echo "Starting test now..."
/reproducer
ret=$?
end=$(busybox date +%s)
echo "Test exited with status $ret after $((end-start)) seconds"
/bin/busybox is a statically linked version of BusyBox, often used in minimal
systems like this to provide all basic Linux shell utilities (including a shell
itself).
The initramfs can be built like this (from a Linux kernel source tree), where list.txt is the file list above:
scripts/gen_initramfs_list.sh -o initramfs.gz list.txt
And QEMU can boot the kernel and initramfs directly:
qemu-system-x86_64 -kernel /boot/vmlinuz-4.13.9-gentoo -initrd initramfs.gz -append 'console=ttyS0' -smp 8 -nographic -serial mon:stdio -cpu host -enable-kvm
This resulted in no output at all to the console… and then I realized I hadn’t even compiled 8250 serial port support into my laptop’s kernel. D’oh. I mean, it doesn’t have a physical serial port, right? Anyway, a quick detour to rebuild the kernel with serial support (and crossing my fingers that didn’t change anything important), I tried again and it successfully booted and ran the reproducer.
Did it crash? Yup. Good, this means the problem is reproducible on a VM on the same machine. I tried the same QEMU command on my home server, with its own kernel, and… nothing. Then I copied the kernel from my laptop and booted that and… it crashed. The kernel is what matters. It’s not a hardware issue.
Juggling kernels
At this point, I knew I was going to be compiling lots of kernels to try to narrow this down. So I decided to move to the most powerful machine I had lying around: a somewhat old 12-core, 24-thread Xeon (now defunct, sadly). I copied the known-bad kernel source to that machine, built it, and tested it.
It didn’t crash.
What?
Some head-scratching later, I made sure the original bad kernel binary crashed (it did). Are we back to hardware? Does it matter which machine I build the kernel on? So I tried building the kernel on my home server, and that one promptly triggered the crash. Building the same kernel on two machines yields crashes, a third machine doesn’t. What’s the difference?
Well, these are all Gentoo boxes, and all Gentoo Hardened at that. But my laptop
and my home server are both ~amd64 (unstable), while my Xeon server is amd64
(stable). That means GCC is different. My laptop and home server were both on
gcc (Gentoo Hardened 6.4.0 p1.0) 6.4.0, while my Xeon was on
gcc (Gentoo Hardened 5.4.0-r3 p1.3, pie-0.6.5) 5.4.0.
But my home server’s kernel, which was nearly the same version as my laptop (though not exactly), built with the same GCC, did not reproduce the crashes. So now we have to conclude that both the compiler used to build the kernel and the kernel itself (or its config?) matter.
To narrow things down further, I compiled the exact kernel tree from my laptop
on my home server (linux-4.13.9-gentoo), and confirmed that it indeed crashed.
Then I copied over the .config from my home server and compiled that, and
found that it didn’t. This means we’re looking at a kernel config difference
and a compiler difference:
- linux-4.13.9-gentoo + gcc 5.4.0-r3 p1.3 + laptop .config - no crash
- linux-4.13.9-gentoo + gcc 6.4.0 p1.0 + laptop .config - crash
- linux-4.13.9-gentoo + gcc 6.4.0 p1.0 + server .config - no crash
Two .configs, one good, and one bad. Time to diff them. Of course, the two
configs were vastly different (since I tend to tailor my kernel config to only
include the drivers I need on any particular machine), so I had to repeatedly
rebuild the kernel while narrowing down the differences.
I decided to start with the “known bad” .config and start removing things.
Since the reproducer takes a variable amount of time to crash, it’s easier to
test for “still crashes” (just wait for it to crash) than for “doesn’t crash”
(how long do I have to wait to convince myself that it doesn’t?). Over the
course of 22 kernel builds, I managed to simplify the
config so much that the kernel had no networking
support, no filesystems, no block device core, and didn’t even support PCI
(still works fine on a VM though!). My kernel builds now took less than 60
seconds and the kernel was about 1/4th the size of my regular one.
Then I moved on to the “known good” .config and removed all the unnecessary
junk while making sure it still didn’t crash the reproducer (which was trickier
and slower than the previous test). I had a few false branches, where I changed
something that made the reproducer start crashing (but I didn’t know what), yet
I misidentified them as “no crash”, so when I got a crash I had to walk back up
the previous kernels I’d built and make sure I knew exactly where the crash was
introduced. I ended up doing 7 kernel builds.
Eventually, I narrowed it down to a small handful of different .config options.
A few of them stood out, in particular CONFIG_OPTIMIZE_INLINING. After
carefully testing them I concluded that, indeed, that option was the culprit.
Turning it off produced kernels that crash the reproducer testcase, while
turning it on produced kernels that didn’t. This option, when turned on,
allows GCC to better determine which inline functions really must be inlined,
instead of forcing it to inline them unconditionally. This also explains the GCC
connection: inlining behavior is likely to change between GCC versions.
/*
 * Force always-inline if the user requests it so via the .config,
 * or if gcc is too old.
 * GCC does not warn about unused static inline functions for
 * -Wunused-function.  This turns out to avoid the need for complex #ifdef
 * directives.  Suppress the warning in clang as well by using "unused"
 * function attribute, which is redundant but not harmful for gcc.
 */
#if !defined(CONFIG_ARCH_SUPPORTS_OPTIMIZED_INLINING) ||                \
    !defined(CONFIG_OPTIMIZE_INLINING) || (__GNUC__ < 4)
#define inline inline           __attribute__((always_inline,unused)) notrace
#define __inline__ __inline__   __attribute__((always_inline,unused)) notrace
#define __inline __inline       __attribute__((always_inline,unused)) notrace
#else
/* A lot of inline functions can cause havoc with function tracing */
#define inline inline           __attribute__((unused)) notrace
#define __inline__ __inline__   __attribute__((unused)) notrace
#define __inline __inline       __attribute__((unused)) notrace
#endif
So what next? We know that CONFIG_OPTIMIZE_INLINING makes the difference, but
that potentially changes the behavior of every single inline function across
the whole kernel. How to pinpoint the problem?
I had an idea.
Hash-based differential compilation
The basic premise is to compile part of the kernel with the option turned on, and part of the kernel with the option turned off. By testing the resulting kernel and checking whether the problem appears or not, we can deduce which subset of the kernel compilation units contains the problem code.
Instead of trying to enumerate all object files and doing some kind of binary search, I decided to go with a hash-based approach. I wrote this wrapper script for GCC:
#!/bin/bash
args=("$@")

doit=
while [ $# -gt 0 ]; do
        case "$1" in
                -c)
                        doit=1
                        ;;
                -o)
                        shift
                        objfile="$1"
                        ;;
        esac
        shift
done

extra=
if [ ! -z "$doit" ]; then
        sha="$(echo -n "$objfile" | sha1sum - | cut -d" " -f1)"
        echo "${sha:0:8} $objfile" >> objs.txt
        if [ $((0x${sha:0:8} & (0x80000000 >> $BIT))) = 0 ]; then
                echo "[n]" "$objfile" 1>&2
        else
                extra=-DCONFIG_OPTIMIZE_INLINING
                echo "[y]" "$objfile" 1>&2
        fi
fi

exec gcc $extra "${args[@]}"
This hashes the object file name with SHA-1, then checks a given bit of the
hash out of the first 32 bits (identified by the $BIT environment variable).
If the bit is 0, it builds without CONFIG_OPTIMIZE_INLINING. If it is 1,
it builds with CONFIG_OPTIMIZE_INLINING. I found that the kernel had around
685 object files at this point (my minimization effort had paid off), which
requires about 10 bits for a unique identification. This hash-based approach
also has one neat property: I can choose to only worry about crashing outcomes
(where the bit is 0), since it is much harder to prove that a given kernel build
does not crash (as the crashes are probabilistic and can take quite a while
sometimes).
I built 32 kernels, one for each bit of the SHA-1 prefix, which only took 29 minutes. Then I started testing them, and every time I got a crash, I narrowed down a regular expression of possible SHA-1 hashes to only those with zero bits at those specific positions. At 8 crashes (and thus zero bits), I was down to 4 object files, and a couple were looking promising. Once I hit the 10th crash, there was a single match.
$ grep '^[0246][012389ab][0189][014589cd][028a][012389ab][014589cd]' objs_0.txt
6b9cab4f arch/x86/entry/vdso/vclock_gettime.o
vDSO code. Of course.
vDSO shenanigans
The kernel’s vDSO is not actually kernel code. vDSO is a small shared library that the kernel places in the address space of every process, and which allows apps to perform certain special system calls without ever leaving user mode. This increases performance significantly, while still allowing the kernel to change the implementation details of those system calls as needed.
In other words, vDSO is GCC-compiled code, built with the kernel, that ends up being linked with every userspace app. It’s userspace code. This explains why the kernel and its compiler mattered: it wasn’t about the kernel itself, but about a shared library provided by the kernel! And Go uses the vDSO for performance. Go also happens to have a (rather insane, in my opinion) policy of reinventing its own standard library, so it does not use any of the standard Linux glibc code to call vDSO, but rather rolls its own calls (and syscalls too).
So what does flipping CONFIG_OPTIMIZE_INLINING do to the vDSO? Let’s look at
the assembly.
With CONFIG_OPTIMIZE_INLINING=n:
arch/x86/entry/vdso/vclock_gettime.o.no_inline_opt:     file format elf64-x86-64


Disassembly of section .text:

0000000000000000 <vread_tsc>:
   0:	55                   	push   %rbp
   1:	48 89 e5             	mov    %rsp,%rbp
   4:	90                   	nop
   5:	90                   	nop
   6:	90                   	nop
   7:	0f 31                	rdtsc
   9:	48 c1 e2 20          	shl    $0x20,%rdx
   d:	48 09 d0             	or     %rdx,%rax
  10:	48 8b 15 00 00 00 00 	mov    0x0(%rip),%rdx        # 17 <vread_tsc+0x17>
  17:	48 39 c2             	cmp    %rax,%rdx
  1a:	77 02                	ja     1e <vread_tsc+0x1e>
  1c:	5d                   	pop    %rbp
  1d:	c3                   	retq
  1e:	48 89 d0             	mov    %rdx,%rax
  21:	5d                   	pop    %rbp
  22:	c3                   	retq
  23:	0f 1f 00             	nopl   (%rax)
  26:	66 2e 0f 1f 84 00 00 	nopw   %cs:0x0(%rax,%rax,1)
  2d:	00 00 00

0000000000000030 <__vdso_clock_gettime>:
  30:	55                   	push   %rbp
  31:	48 89 e5             	mov    %rsp,%rbp
  34:	48 81 ec 20 10 00 00 	sub    $0x1020,%rsp
  3b:	48 83 0c 24 00       	orq    $0x0,(%rsp)
  40:	48 81 c4 20 10 00 00 	add    $0x1020,%rsp
  47:	4c 8d 0d 00 00 00 00 	lea    0x0(%rip),%r9        # 4e <__vdso_clock_gettime+0x1e>
  4e:	83 ff 01             	cmp    $0x1,%edi
  51:	74 66                	je     b9 <__vdso_clock_gettime+0x89>
  53:	0f 8e dc 00 00 00    	jle    135 <__vdso_clock_gettime+0x105>
  59:	83 ff 05             	cmp    $0x5,%edi
  5c:	74 34                	je     92 <__vdso_clock_gettime+0x62>
  5e:	83 ff 06             	cmp    $0x6,%edi
  61:	0f 85 c2 00 00 00    	jne    129 <__vdso_clock_gettime+0xf9>
[...]
With CONFIG_OPTIMIZE_INLINING=y:
arch/x86/entry/vdso/vclock_gettime.o.inline_opt:     file format elf64-x86-64


Disassembly of section .text:

0000000000000000 <__vdso_clock_gettime>:
   0:	55                   	push   %rbp
   1:	4c 8d 0d 00 00 00 00 	lea    0x0(%rip),%r9        # 8 <__vdso_clock_gettime+0x8>
   8:	83 ff 01             	cmp    $0x1,%edi
   b:	48 89 e5             	mov    %rsp,%rbp
   e:	74 66                	je     76 <__vdso_clock_gettime+0x76>
  10:	0f 8e dc 00 00 00    	jle    f2 <__vdso_clock_gettime+0xf2>
  16:	83 ff 05             	cmp    $0x5,%edi
  19:	74 34                	je     4f <__vdso_clock_gettime+0x4f>
  1b:	83 ff 06             	cmp    $0x6,%edi
  1e:	0f 85 c2 00 00 00    	jne    e6 <__vdso_clock_gettime+0xe6>
[...]
Interestingly, CONFIG_OPTIMIZE_INLINING=y, which is supposed to allow GCC to
inline less, actually resulted in it inlining more: vread_tsc is inlined in
that version, while not in the CONFIG_OPTIMIZE_INLINING=n version. But
vread_tsc isn’t marked inline at all, so GCC is perfectly within its right to
behave like this, as counterintuitive as it may be.
But who cares if a function is inlined? Where’s the actual problem? Well, looking closer at the non-inline version…
  30:	55                   	push   %rbp
  31:	48 89 e5             	mov    %rsp,%rbp
  34:	48 81 ec 20 10 00 00 	sub    $0x1020,%rsp
  3b:	48 83 0c 24 00       	orq    $0x0,(%rsp)
  40:	48 81 c4 20 10 00 00 	add    $0x1020,%rsp
Why is GCC allocating over 4KiB of stack? That’s not a stack allocation, that’s
a stack probe, or more specifically, the result of the -fstack-check GCC
feature.
Gentoo Linux enables -fstack-check-fstack-check-fstack-check
Go loves small stacks.
TEXT runtime·walltime(SB),NOSPLIT,$16
	// Be careful. We're calling a function with gcc calling convention here.
	// We're guaranteed 128 bytes on entry, and we've taken 16, and the
	// call uses another 8.
	// That leaves 104 for the gettime code to use. Hope that's enough!
Turns out 104 bytes aren’t enough for everybody. Certainly not for my kernel.
It’s worth pointing out that the vDSO specification makes no mention of maximum stack usage guarantees, so this is squarely Go’s fault for making invalid assumptions.
Conclusion
This perfectly explains the symptoms. The stack probe is an orq, which is a
logical OR with 0. This is a no-op, but effectively probes the target address
(if it is unmapped, it will segfault). But we weren’t seeing segfaults in vDSO
code, so how was this breaking Go? Well, OR with 0 isn’t really a no-op. Since
orq is not an atomic instruction, what really happens is the CPU reads the
memory address and then writes it back. This creates a race condition. If other
threads are running in parallel on other CPUs, orq might effectively wind up
undoing a memory write that occurs simultaneously. Since the write was out of
the stack bounds, it was likely intruding on other threads’ stacks or random
data, and, when the stars line up, undoing a memory write. This is also why
GOMAXPROCS=1 works around the issue, since that prevents two threads from
effectively running Go code at the same time.
What’s the fix? I left that up to the Go devs. Their solution ultimately was to
pivot to a larger stack
before calling vDSO functions. This introduces a small speed penalty
(nanoseconds), but it’s acceptable. After building node_exporter with the
fixed Go toolchain, the crashes went away.